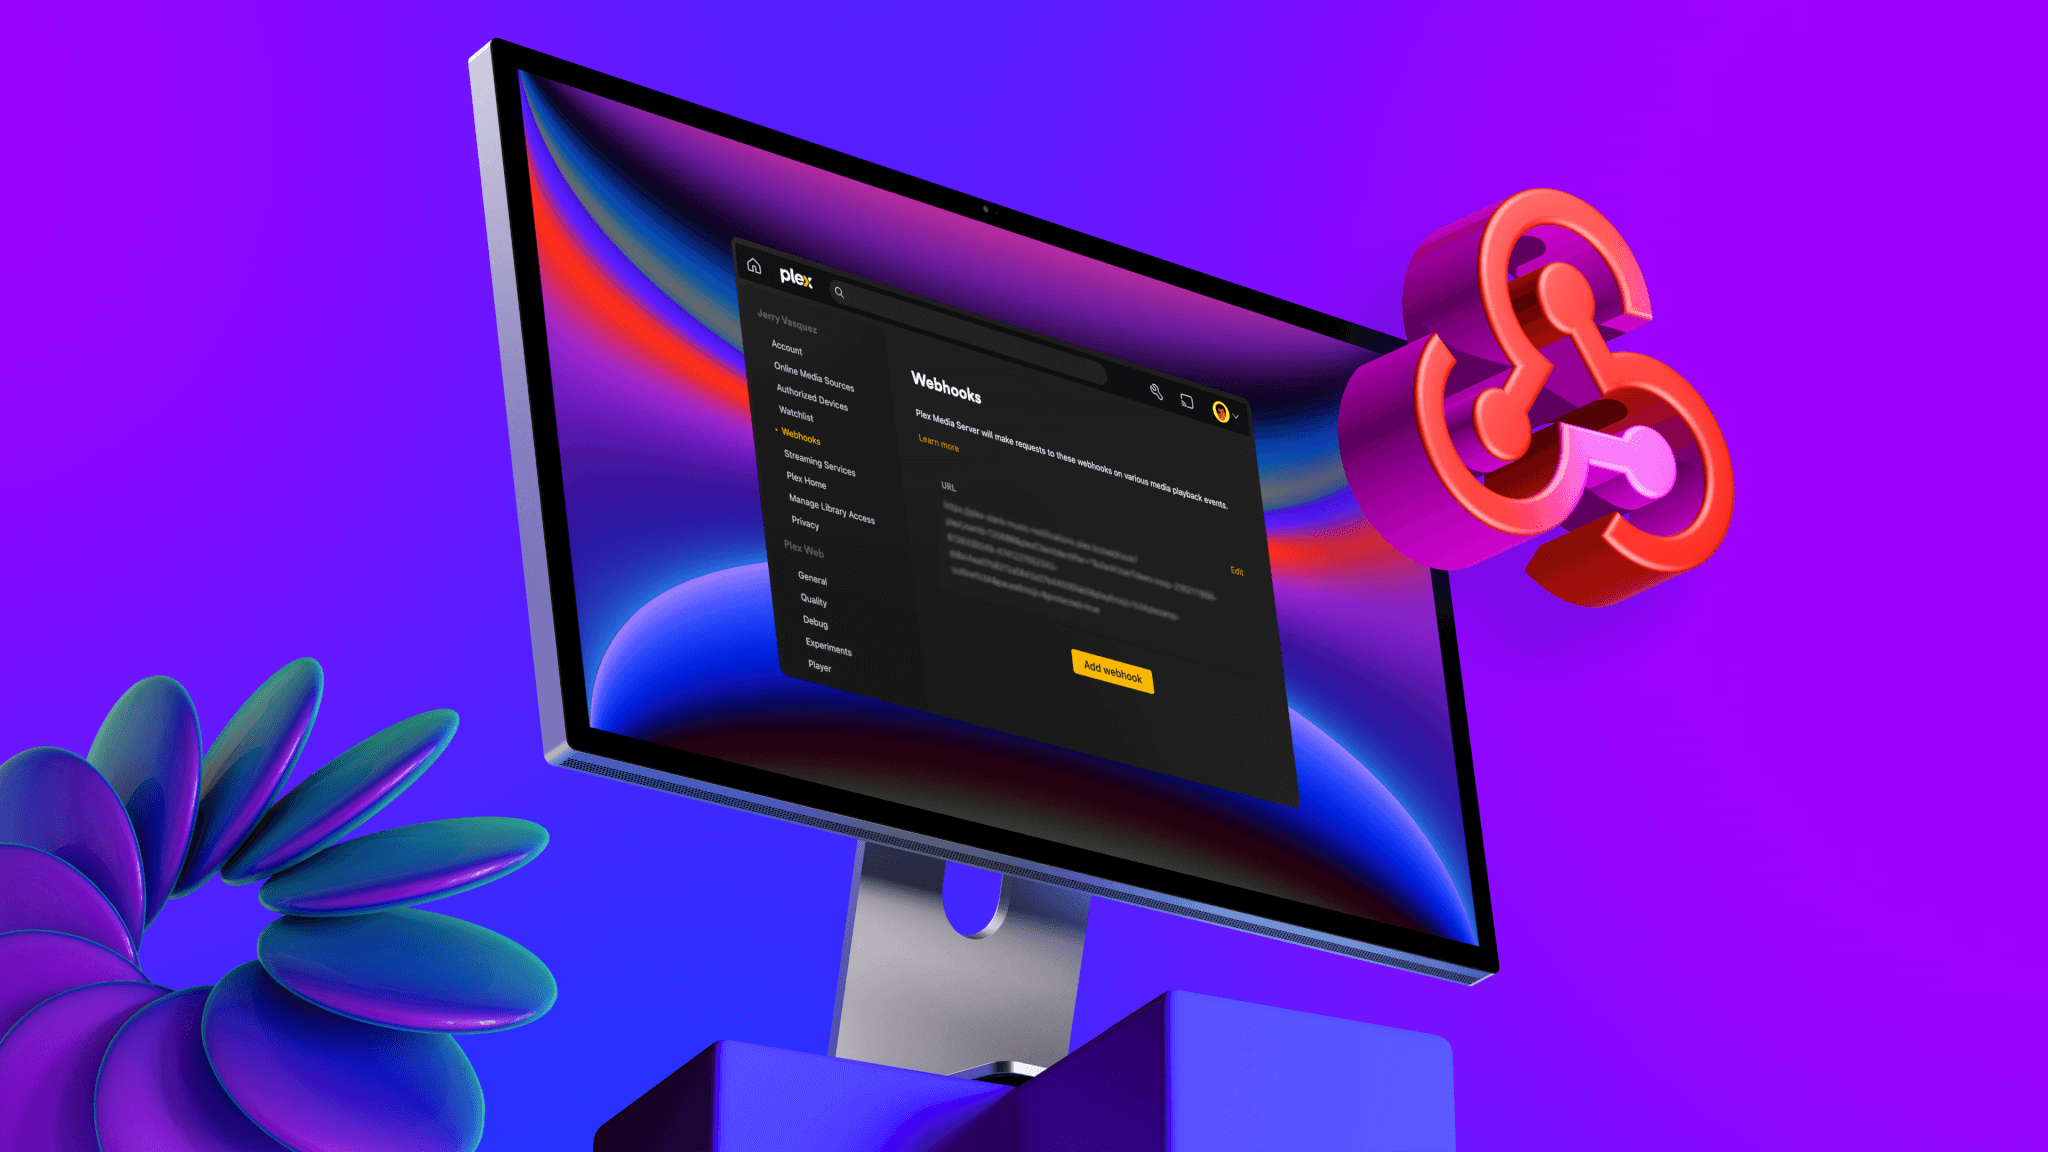
Looking for complete and total data visibility when it comes to your Plex media server? Big same. Legendary Pro Week alum Techno Tim is here to show you how to use Plex Open API, along with Prometheus and Grafana, to build a truly “all the things” dashboard. By the end of this session, you’ll have all the instructions you need to build and configure the mother of all dashboards so that you can easily monitor CPU temps, disk health, network speeds, and more.
About Tim
Software engineer and content creator, Timothy Stewart, aka Techno Tim, is a full stack software engineer, content creator, and a HomeLab enthusiast. Tim creates fun and easy-to-follow tech content on YouTube, hosts a community live stream on Twitch, and shares tech-related content on all social platforms. With a passion for all things tech, Tim enjoys diving deep into a technical topic, and teaching it along the way.
More Support
Want a deeper dive? We’ve got you covered:
Server Status and Dashboard
Need to start from the beginning? Here’s how to get your server up and running:
Intro to Plex
Quick-Start Guide to Server Set-Up
More on Plex Media Server Installation


